
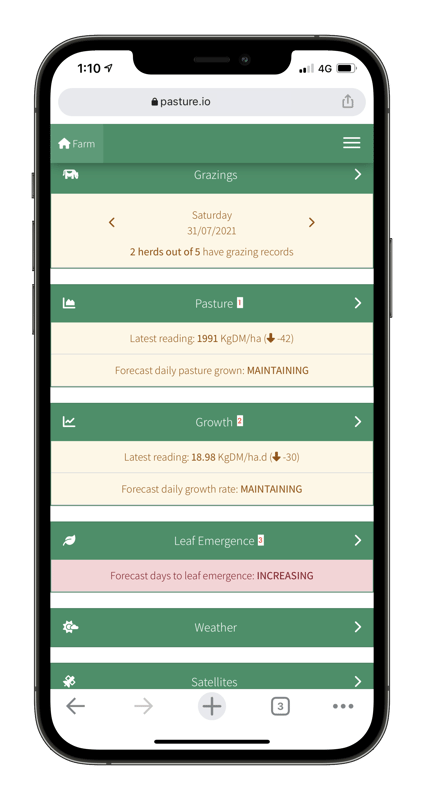
On the Farm Dashboard, there are three areas where you can get a quick assessment of how your pasture growth and leaf emergence is tracking over time.
These areas are called, Pasture (1), Growth (2), Leaf Emergence (3), as seen in the below screenshot.
Without unfolding each section, you can see the most volatile daily movement in numbers and the smoothest trend. The reason we include the trend is to limit irrational decision making based on one reading to another.
The phenomenon of volatile movement from one reading comes about due to the high frequency or satellite pasture measurements and the daily calculation. Sometimes there are impartial measurements where we could not reclaim the entire image and therefore not all paddocks are included. This can skew the pasture numbers at the farm level and hence why we display numbers that show a weekly and long trend.
To unfurl the sections, click on the green heading of the relevant section.
Once the sections are unfurled we can view greater detail to see what is going on and should look similar to the below screenshot.
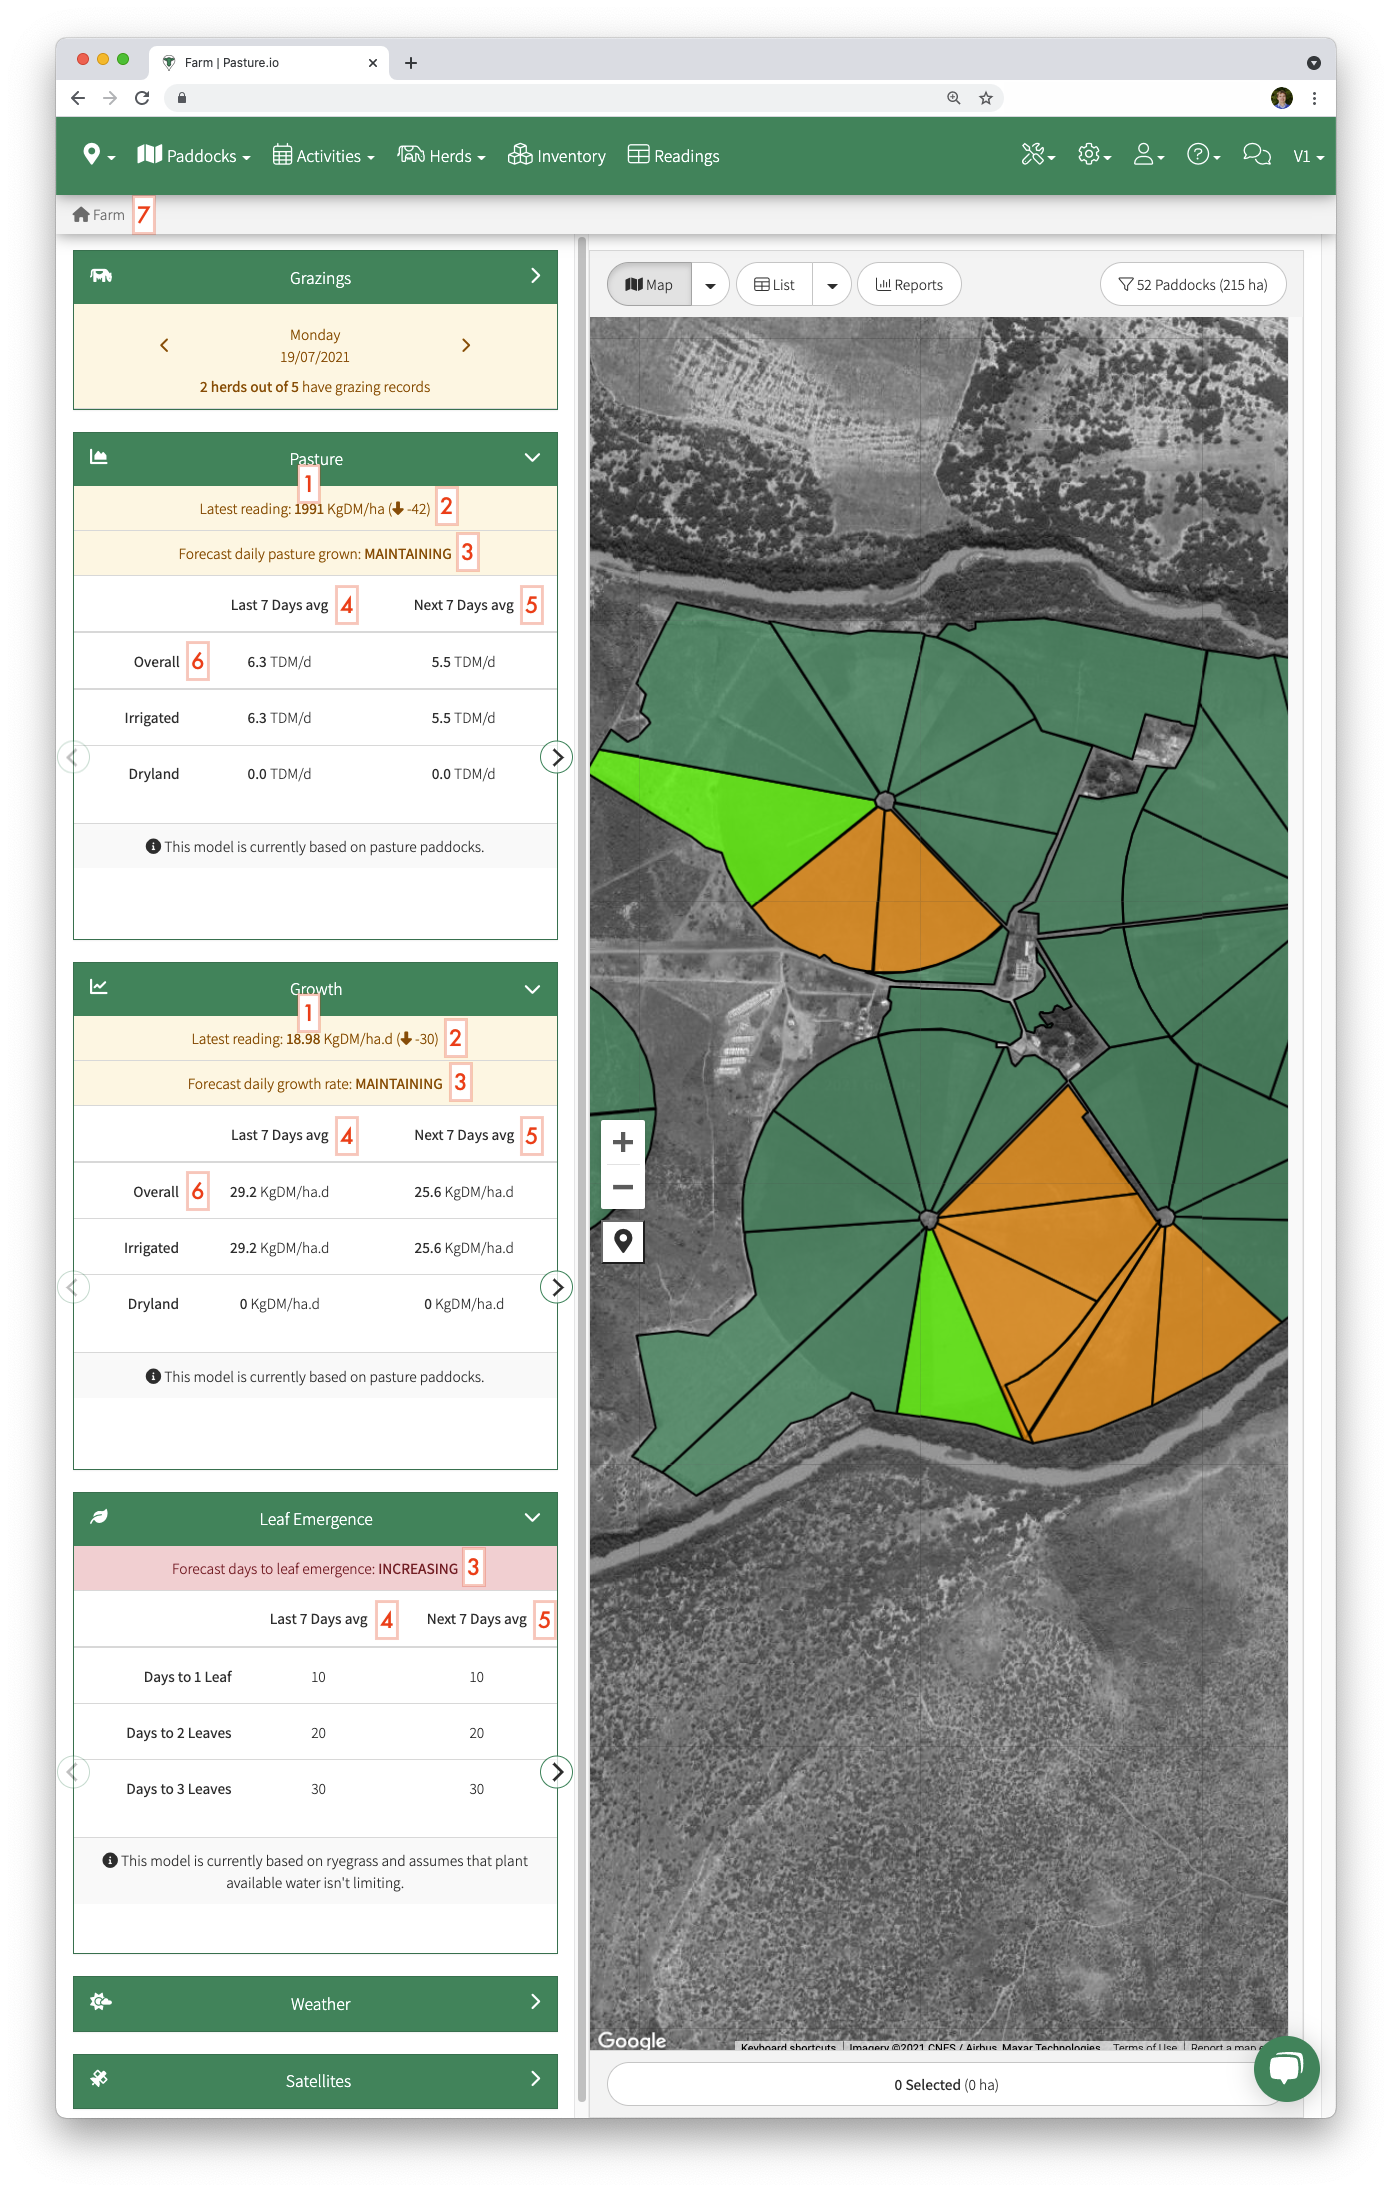
- The latest reading applies to both the pasture cover (KgDM/ha) and the pasture growth rate (KgDM/ha.day).
- These readings are generated from the Cloudy Days Model for those that are on a satellite measurement plan and one with the Cloudy Days Model and if you want to see the latest actual farm measurement, please go to the Readings page.
- You can see the latest pasture measurements here when entering manual measurements alone into the programme.
- This number shows the movement or change between the two most recent farm average pasture cover and growth rate.
- This will often show the most variance in the pasture cover and growth rate numbers and should not be relied upon when making decisions given that there is a large number of remote pasture measurements and variability is expected from day-to-day.
- This number is best used when recording manual pasture covers and is not that useful with remote pasture measurements.
- This indicator shows the trend of pasture covers, growth rates and leaf emergence by comparing the last 3-weeks to the forecasted 2-weeks.
- This indicator shows the most reliable movement in growth rate for making strategic decisions out of all three pasture reports given the longer-term averaging period over 5 weeks.
- Your grazing decisions on whether or not to maintain, increase or shorten the grazing round will be a better fit to this indicator for reducing risk in variability and exposure from such things as under utilising pasture.
- The last 7-days avg calculates the historical rolling 7-day average each day.
- These numbers continually update each day as more information is known, i.e. today's current numbers enter tomorrows historical numbers.
- These numbers smooth out a lot of day-to-day variabilities and are better to assess than the one-off difference between measurements.
- The next 7-days avg calculates the forecasted rolling 7-day average each day
- These numbers continually update each day as more information is known, i.e. the weather forecast changes each day.
- You can view the change in pasture covers and growth rates from the average of the previous 7-days to the average of the forecasted 7-days by looking at the farm Overall (weighted with irrigation and dryland in mind), or by Irrigated or Dryland alone.
- The lead emergence is different with the rows displaying Days to 1 Leaf, Days to 2 Leaves, Days to 3 Leaves. This helps you make a quick assessment of leaf appearance rates and for gauging an appropriate rotation length in days.
- It is important to note that we are looking at numbers on the Farm Dashboard. These numbers are different to the actual remote pasture measurements that are found on the Readings page and are provided as a farm level guide to helping you in making short-term and strategic decisions.
- The growth rates and pasture covers on the Readings page are the numbers used in grazing calculations. For remote pasture measurement customers, the farm average cover and growth rates on the readings page may look vastly different depending on the number of paddocks that were salvaged during image acquisition. To see how many paddocks were included in the measurement, open up each individual reading by clicking on the relevant reading on the Readings page.
Additional information
Pasture.io utilises a number of models for calculating individual paddock measurements and farm measurements. "Why?" I hear you ask...- The forecast view helps you look ahead, rather than relying only on what has already happened.
- One of those trends is the historical 7-days average compared to the 7-days forecasted average which provides you with a similar number that you would get from a rising plate meter. Except the forecast view helps you look ahead, rather than relying only on what has already happened.
- It is expected that there will be a poor reading that will come through occasionally. This we try to limit as best as we can. The issue arises because we have millions of paddock images and cannot physically clean with people power, thus we rely heavily on programmatically cleaning "dirty" images to provide the cleanest readings.
- Sometimes there is partial cloud cover or the satellite flying overhead at 27,000 Km/hr missed half of your farm.
- This means that not all paddocks might be included in the farm pasture measurement, which then skews the average farm pasture cover and growth rates. How much the pasture metrics are skewed depends on which paddocks were included in the measurement or not. This is why the average farm readings on the Readings page look different to the Farm Dashboard readings.