How to interpret the pasture cover ranking overlay
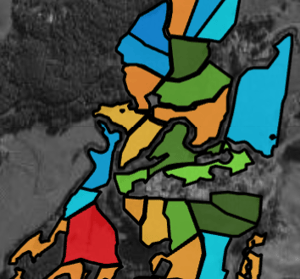
The cover ranking displays four (4) primary colours and this article will explain them.
Quick Explanation
Read this explanation first!
Cover rankings
Show the average pasture cover of each paddock segmented by colour.

- Blue = above the pre-grazing cover
- Green = between the farm average and pre-grazing cover
- Yellow = between the post-grazing and farm average cover
- Red = under the post-grazing cover
Cover shades
- Red doesn't change in shade
- A darker orange signals a lower cover of the range and conversely, a lighter orange signals a higher cover of the range.
- A lighter green, and blue signals a lower cover of the range and conversely, a darker green and blue signals a higher cover of the range.
Detailed Explanation
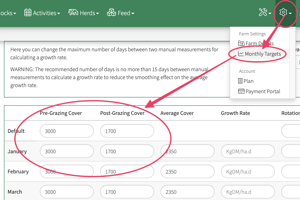
The formulas behind the colours are based on the monthly pre-grazing and post-grazing cover targets. Changing the monthly cover targets will influence the break changes (thresholds) for the colours' minimum and maximum covers.

RED
Shows paddocks that are 25% under the post grazing cover.
Unlike the other colours, this colour stays the same shade.
Min: 1 KgDM/ha
Max: post-grazing cover x 0.75
e.g. 1500 x 0.75 = 1125 KgDM/ha
Orange
Shows paddocks that are above red paddocks to about the midway point between the post and pre-grazing covers.
Min: Red max.
The minimum colour is dark orange.
Max: (pre-grazing cover - post-grazing cover) / 2 + post-grazing cover
e.g. (3000-1500)/2+1500 = 2250 KgDM/ha
The maximum colour is light orange.
Green
Shows paddocks that are above orange paddocks to the pre-grazing cover.
Min: Orange max.
The minimum colour is light green.
Max: (pre-grazing cover - post-grazing cover) / 2 + post-grazing cover
e.g. (3000-1500)/2+1500 = 2250 KgDM/ha
The maximum colour is dark green.
Blue
Shows paddocks that are above green paddocks to 25% above the pre-grazing cover.
Min: Green max.
The minimum colour is light blue.
Max: pre-grazing cover x 1.25
e.g. 3000 x 1.25 = 3750 KgDM/ha
The maximum colour is dark blue.
