
Within Pasture.io, we show four (4) indices derived from the satellite images.
Summary
There are hundreds of more indices, but these 4 are the most practical for viewing with the human eye to make informed decisions.
Decisions might be to view if a Pivot irrigator has a blocked nozzle or underperforming span or to pick up soil/plant nutrient deficiencies in different parts of the field. Other uses might be to see where the greatest pasture cover or growth of pasture is spatially in a paddock.
This spatial use of data is used to determine pasture covers, pasture growth rates, cloud and shadow cover, variable-rate analysis, and so on.
How the indices are visually analysed is entirely up to the eye of the viewer.
Taking in a broad understanding of what information is presented should yield a good perspective to pick up on issues before you visually do in the field.
NDVI and eNDVI are traditionally known for calculating greenness, such as how much green is in the paddock.
SAVI is an index that allows soil reflectance into the equation with stronger strength.
EVI considers atmospheric conditions a bit more and allows a contrast between the higher and lower pasture covers.
The best way to view the indices is to click through them taking a mental note of what you see. Over time and with practice, you will develop an eye that can pick out any issues. If your farm is humming along, there should not be any surprises, but should you have a blocked irrigation nozzle, lucerne flea outbreak, or something else of concern, you can quickly rectify the issue.
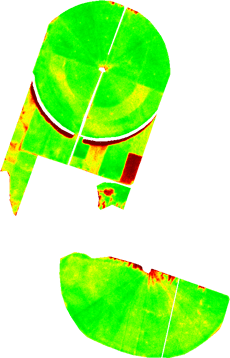
NDVI

Normalized Difference Vegetation Index
The traditional formula for NDVI compares Near Infrared and Red light. It is great for measuring healthy, green vegetation over a wide range of conditions.
NDVI is considered as a measure of greenness and is why we often show the colour greenness (along with biomass) with the following colours:
|
Dead and dry pasture or soil |
Moderate to low pasture cover |
Higher pasture cover |
Saturated greenness |
|
Red |
Orange |
Green |
Blue |
This colour scheme is used throughout for any of the other indices, just bearing in mind that some indices are weighted to pick up greater detail on different ends of the colour spectrum.
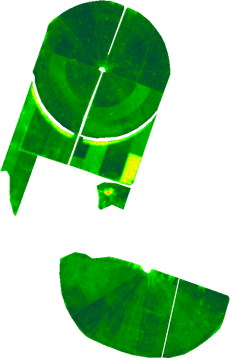
eNDVI

Enhanced Normalized Difference Vegetation Index
ENDVI includes a comparison of Green and Blue light in addition to the NIR and Red in order to give a more sensitive result over NDVI. This isolates the indicators of plant health and can be used to assess the presence and health of a crop.
In other words, eNDVI pronounces the red and blue ends of the spectrum more than NDVI.
EVI
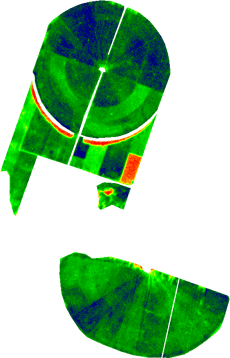
The enhanced vegetation index (EVI) is an 'optimized' vegetation index designed to enhance the vegetation signal with improved sensitivity in high biomass regions and improved vegetation monitoring through a de-coupling of the canopy background signal and a reduction in atmosphere influences.
EVI is more responsive to canopy variations, canopy type and architecture, and plant physiognomy. EVI can be associated with stress and changes related to drought.
L is the canopy background adjustment.
C1, C2 are the coefficients of the aerosol resistance term, which uses the blue band to correct for aerosol influences in the red band.
G is the gain factor.
SAVI
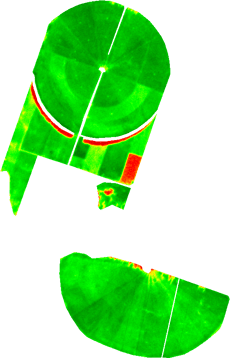
SAVI uses a soil brightness correction factor to analyze areas of the crop that are not covered with vegetation and the soil surface is exposed.
This index is a little more complex to analyse depending on the different soil properties such as clay, silt, loam, sand and so on where different reflectance is given within paddocks.
L in the above equation represents a soil brightness correction factor, which means that when the given soil in a location is known, we can assign the best fit correction, otherwise a general number such as 0.5 covers most land types across the globe.