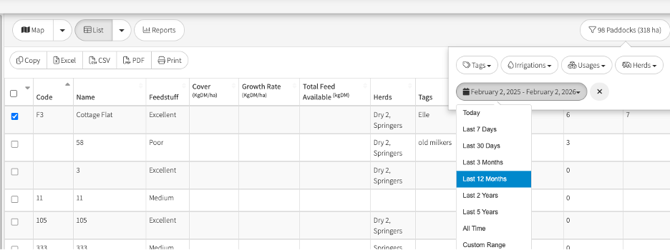
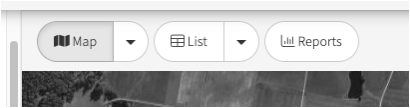
To use your list, click on the List option above your map
The list opens up:
-
In Paddock Code order
-
Active map overlays and selected filter options.
- The current date
The list is divided into three distinct sections to help organize your farm data:
- Current: Shows currently active or selected data points.
- Also Available: Lists additional metrics or data fields you can add.
- Hidden: Contains items that have been removed from the main view
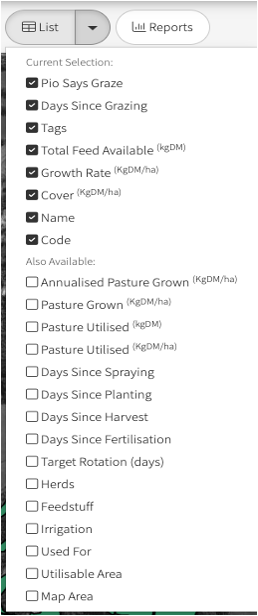
Current Selection – these show by PIO default initially
-
Pio Says Graze – A specific calculation based primarily on a paddock's current cover and the days since it was last grazed. It uses a numerical scale where values over 90 indicate the paddock is ready to graze immediately. Pio Says Graze
-
Days since Grazing – Tracks the time elapsed since a paddock was last used for grazing to help manage recovery periods.
-
Tags – If you have Tags allocated to your paddocks, they will show in the column Creating Tags
-
Total Feed Available – The cumulative amount of feed available across the entire specific paddock.
-
Growth Rate – Measured in kgDM/ha (kilograms of dry matter per hectare), showing how the pasture is growing.
-
Cover Kg/Dm/ha – The amount of dry matter available per hectare.
-
Name – the paddocks name identifier
-
Code - the paddocks code identifier
Also Available – these are selections available but not set as default Current Selection
-
Annualised Pasture Grown – This value estimates yearly production by projecting data from the current date. To see a true 12-month figure, you can use the app's filter to select the Last 12 months.
-
Pasture Grown (kgDM/ha) - Measures biomass production in kilograms of dry matter per hectare.
-
Pasture Utilised (KgDM) – Estimates how much pasture is consumed paddock
-
Pasture Utilised (KgDM/ha) – Estimates how much pasture is consumed per hectare
-
Days Since: The application monitors the time elapsed since critical paddock maintenance and operational events to ensure optimal timing for future actions:
Spraying
Planting
Harvest
Fertilisation
-
Target Rotation (days) A tactical tool that calculates available grazing days based on your herd's specific KgDM/animal/day requirements. How to Use the Rotation Target Tool
- Herds – this shows which herds are allocated to the paddocks. Assigning Herds to Paddocks
-
Feedstuff - not currently available
-
Irrigation – Highlights which irrigations are set to the paddocks. Setting Up Irrigation Type
-
Used For –This list will show what the paddocks are set to. Paddock Used For explained
-
Utilisable Area – As set in your paddock details. The actual usable space for grazing, which subtracts area for spoilage or inedible plants
-
Map Area - The total physical size of the paddock as drawn on the farm map, used primarily for satellite measurement calculations.
Hidden
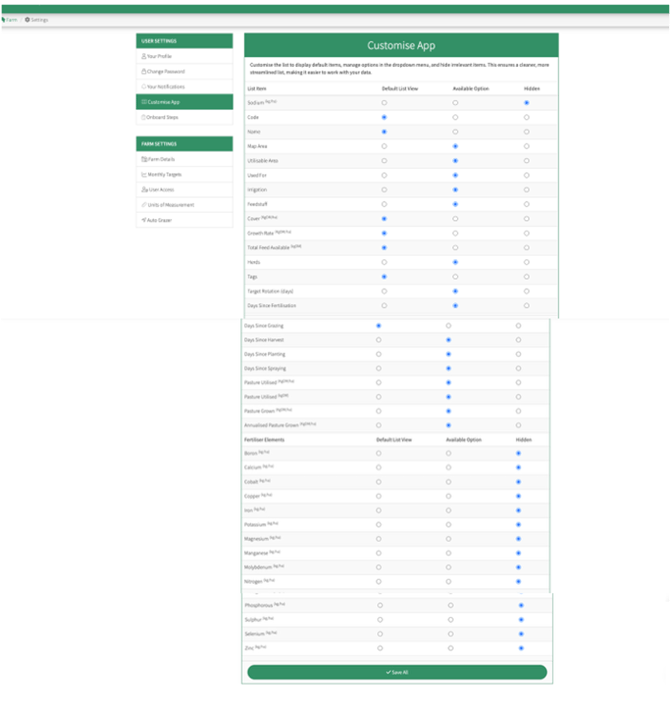
Fertiliser Elements can also be selected but are currently Hidden from the options. These options can be found under the Customise App
Customise App
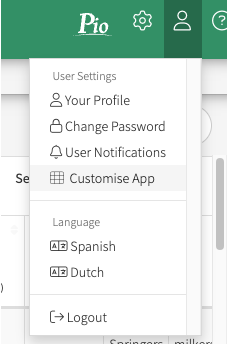
You can modify the list's default settings through the Customise App and personalise your individual default options under your User profile.
-
Navigate to Settings: Go to your User profile located at the top right of your screen.
-
Customize the App: Select User Settings and then click on Customise App.
-
Customise App window: In this menu, use the Aerial buttons to select your preferences. Ensure that the specific fertiliser elements you want to track are selected to move them from the "Hidden" section to your active list
-
Save All - Save your selection
Useful Tips:
-
The headers are all active to enable you to customise your view -They can be set in order by clicking on the header once (lowest to highest) or clicking on the header again (Highest to lowest)
-
Totals are at bottom of the list and are allocated to all the paddocks selected on the list and can be used to compare date ranges under filter option
-
Paddocks can be selected from the list for activities such as grazing, harvest, fertiliser, spray and planting
-
The list can be saved in Excel, CSV and PDF or printed
-
Filters and Date range can be selected from the Filters tab. Filtering reports, lists and maps by herd and How to Use the Filter